

On the next 8th June, UK voters will be faced with a decisive election, which could have a profound impact not only on British internal affairs but also on the Brexit negotiations with the European Union. Beyond the analysis of the UK public opinion and political parties, derived from the original survey conducted by the CISE, a matter that requires further investigation and has been gaining increasing attention by pundits and the media is surely the forecasting of the composition of the next House of Commons.
In the past few days, more and more experts have been underlying that the Labour party has allegedly reduced the gap with the Conservatives, and after having called a snap election to strengthen her parliamentary majority, the incumbent Prime Minister, Theresa May, risks falling short of a parliamentary majority. This is why we have focused on the analysis of the possible outcomes of the election. We rely on YouGov’s estimates[1] to examine the expected composition of the future Parliament and the marginal seats’ battleground.
Table 1. Outgoing Parliament and YouGov’s expectation for the 8th June
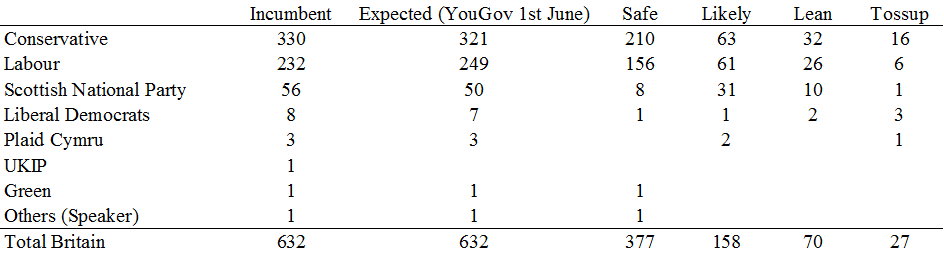
Table 1 shows the composition of the outgoing parliament for Britain[2], the YouGov’s expectations for the 8th June and the internal composition of seats according to the probability of each party to win the seats. The 2015 general election granted an absolute majority of 330 seats to the Tories, while only 232 seats were won by the Labour party. Moreover, the Scottish National Party (SNP) obtained an unprecedented success, winning 56 out of the 59 constituencies in Scotland. Conversely, the Liberal Democrats suffered a catastrophic setback, getting only 8 MPs and the UKIP, notwithstanding a remarkable 12.7 of the seats, were strongly damaged by the First-Past-the-Post electoral system, receiving only 1 seat.
The first striking piece of evidence emerging from Table 1 is that the Conservative party, according to YouGov’s estimates of the 1st June, would fall 5 seats short of an absolute majority. So, a hung Parliament seems to be the most likely outcome. Conversely, Corbyn’s Labour party would increase its representation by more than 15 seats, and the SNP should lose 6 seats compared to 2015[3].
Beyond these overall numbers, the most interesting part of YouGov’s estimates is the analysis of the probability, for each party, to win a seat. According to the British poll group, seats can be classified into four categories: safe seats (where a given party is predicted to comfortably win the election), likely seats (where there is a very high probability for a given party to win), lean seats (where a higher level of competition between or among parties is expected), and, finally, tossup seats (where the race is too close to call).
To have a more fine-grained picture of the election, we have decided to analyse each of the 632 Britain’s constituencies, and we have computed the composition of the expected seats for each party. As it can be noticed by looking at Table 1, out of the 321 expected seats for the Conservatives, 210 can be considered as safe, corresponding to approximately the 65%. Then, 63 seats are likely, 32 are lean, and 16 are tossup. Notice that, for the tossup seats, we have assigned to each party the predicted winner if YouGov has put it in the first position. Turning our attention to the Labour party, 156 seats out of the predicted 249 ones are safe (approximately the 63%), while 61 seats are likely, 26 lean, and just 6 are tossup. A very compelling forecast is that related to the SNP, whose 50 seats are made by just 8 safe seats, while 42 ones are not safe ones (even if 31 are likely and 10 lean ones). It seems that the Scottish seats, at least according to YouGov, have become more competitive than in 2015.
Table 2. Distribution of safe, likely, lean, and tossup seats in Britain (YouGov’s expectation)
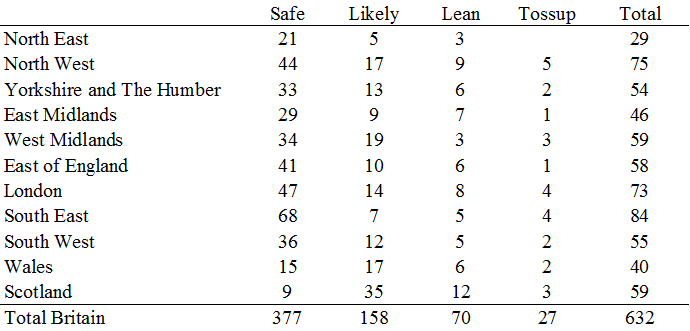
Indeed, a question that is worth asking ourselves is how are the different categories of seats distributed across Britain. Table 2 reports the total number of seats for the 11 Britain’s regions, and also shows the distribution of safe, likely, lean, and tossup seats. Such regions are not equally competitive. Some of them show a very high proportion of safe and likely seats for a party, thus with an expected very low level of competition: specifically, two regions clearly emerge as ‘not competitive’, the North East, a traditional Labour stronghold, and the South East, where, on the contrary, the Conservative party has always dominated. On the other side, the two regions with the highest level of competition are two peripheral ones, Scotland and Wales, with, respectively, the 25% and the 20% of seats falling in the categories of lean or tossup. This is an unexpected conclusion, given that just in 2015 the SNP obtained a landslide in Scotland and Wales was a pro-Labour region.
Obviously, apart from the geographical distribution of seats, the decisive question of this election is to understand whether Theresa May could obtain the absolute majority of seats, or whether another outcome, like a hung parliament or even a Labour majority, can be expected.
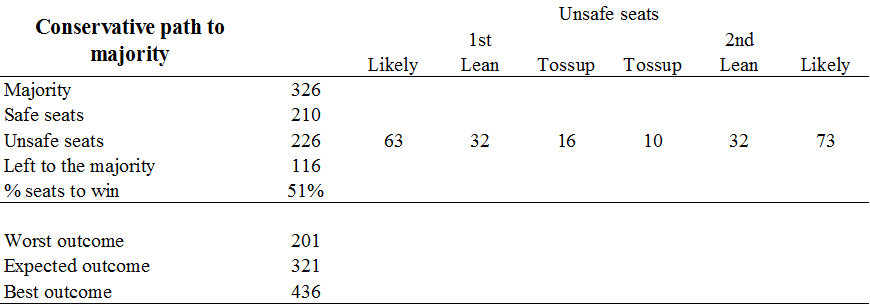
As we know from Table 1, the Conservatives’ starting point is the 210 safe seats. This means that they need to gain at least 116 additional seats to get the absolute majority in the House of Commons. As shown in Table 3 below, the path towards a Conservative majority is at stake across 226 seats. This number is given by the sum of the seats where the Conservatives are the likely, lean or tossup winners, or where they are likely, lean, or tossup runner-up. This means that the party should win in more than 50% of these seats (116 out of 226) to obtain the absolute majority in Parliament. Going more into detail, if the Conservatives win all such 226 races – a very favourable but not very probable outcome – they will obtain a super-majority or 436 seats. Conversely, if they lose all these competitions – a very unfavourable and not at all likely result – the party would go down to 210 seats, definitely a mediocre result. Nonetheless, the very interesting take from Table 3 is that, in order to obtain the absolute majority, and following the estimates of YouGov, not only should the party win all the safe, likely, and lean races where a Conservative candidate tops the polls, but it should also conquer all the tossup seats where they are currently ranked first and at least 5 tossup seats where they are expected to be the runner-up. This means the path towards the Tory majority should not be taken for granted. Yet, we need to consider that Conservatives could also win some challenging race, like the ones in the 95 likely or lean seats where they are expected to be runner-up.
Table 3. Conservative path to majority (YouGov’s expectation)
Notwithstanding the remarkable comeback of the Labour party in the last days of the campaign, the path for Jeremy Corbyn to become the next Prime Minister is, of course, a more complicated one. Indeed, the Labour party could count only on 156 safe seats, and, as shown in Table 4 below, it could compete in further 199 seats, and 170 of these seats (the 85%) are required to reach the absolute majority in the House of Commons. Out of these 199 seats, the Labour party is expected to rank first in 93 ones (of which 61 are likely ones) and they rank second in 106 (or which 13 are tossup). This means that Labour candidates should win all the races where they top the polls and also almost all the races where they are predicted to arrive in the second place. As we were arguing before, this is a very complicated path. To add more, in the most favourable scenario – i.e. if the Labour party wins all these races, it would reach an absolute majority of seats (355). On the contrary, losing all such seats would end up in a Labour parliamentary party reduced to 156 MPs, a very unsatisfactory result. Yet, both outcomes are not very likely. All in all, many different outcomes are possible for the Labour party, but reaching an absolute majority in the House of Commons seems quite complicated.
Table 4. Labour path to majority
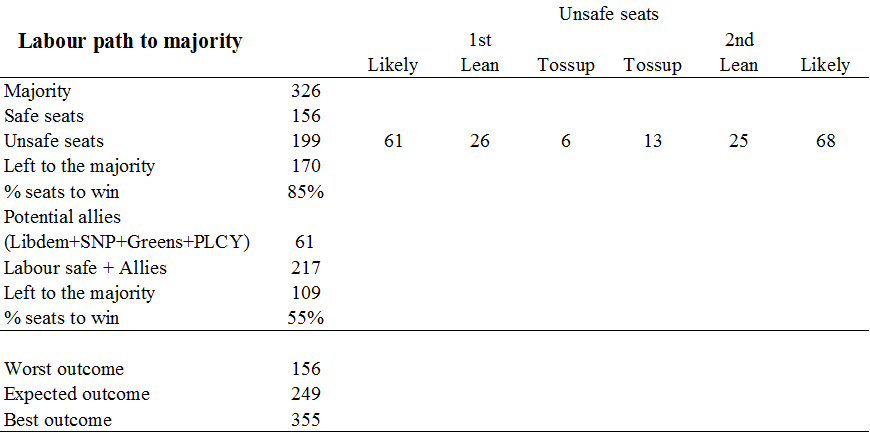
Nonetheless, there is another possibility which should be considered: a coalition government. Among which parties? The Conservatives’ Hard Brexit stance makes it difficult to imagine a coalition between them and the SNP or the Liberal Democrats, two parties that, for different reasons, are not in favour of a disastrous divorce with the European Union. Then, what about the Labour party? Its manifesto, though respecting the results of the Brexit referendum, signals the willingness to reach a comprehensive and middle-of-the-road agreement with Bruxelles. It means that, maybe, the SNP and the Liberal Democrats could agree to enter a coalition government with Corbyn’s party, assuming it reaches the relative majority of seats. Is it a foreseeable scenario? YouGov’s estimates are not optimistic: a three-party coalition (Labour, SNP, and Liberal Democrats) would fall short of the absolute majority of seats (306 seats vs. 326 seats)[4]. This means that to reach 10 Downing Street leading a coalition government, Corbyn must hope his party performs reasonably well on the 8th June, winning in many toss-up and lean races where it is actually in the second position. To make things worse, this last scenario starts from the assumption that the SNP and the Liberal Democrats will win all the races, including the lean and tossup ones where there is not a safe winning margin with the most dangerous opponents. If some of these more uncertain races finish with a victory by – say – the Conservatives, it follows the Labour party, to obtain the relative majority in the House of Commons and be able to form a coalition government, should perform even better.
Table 5. Focus: the 97 marginal seats (YouGov’s expectation)
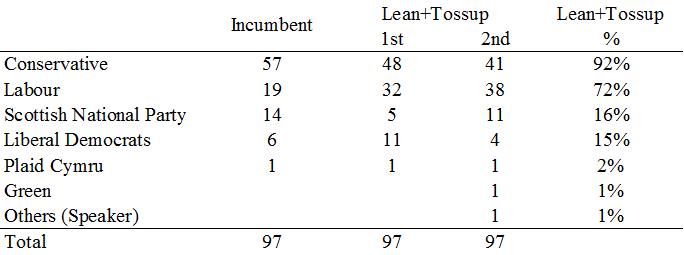
Beyond all the speculations about inter-party post-electoral agreements, it could be useful to look at the marginal seats, where the Conservatives and the Labour are likely to focus their efforts in these very last days of the campaign. Indeed, such seats may result as decisive in assigning the victory to either one or the other party or, conversely, in producing a hung Parliament. Table 5 above summarises the outgoing situation of the 97 seats considered as those where the closest races will be held, and also the forecast result of such races. Almost the 60% of these 97 seats is held by Conservative MPs, and this means that Theresa May’s party starts from a favourable setting. At the same time, this also means that the party needs to retain such seats, while the Labour party can play the somewhat easier role of the underdog (starting from just 19 seats won in 2015). Not surprisingly, the Conservatives contest the 92% of such seats, but what is of interest here is the fact that the Labour party, being the incumbent in less than 20% of these marginal seats, now fights to win in the 72% of the 97 seats.
Table 6. Focus: first and second expected party in the 97 marginal seats (YouGov’s expectation)
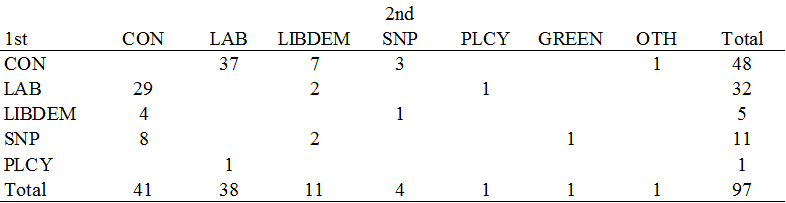
Which is the competition pattern in these 97 marginal seats? Table 6 above disentangles the 97 races according to the first and the second expected party. Specifically, the table displays that the lion’ share of this group of seats will be a matter between the Labour and the Conservatives, with the other parties only playing a significant role in a small number of seats. Indeed, it is likely that the outcome of the election will be decided in the 66 seats where there should be a race between a Conservative and a Labour candidate. More into detail, it is easy to understand that winning a marginal seat in a direct challenge with the other major party in the competition has a double value: not only winning a seat, but taking it away from your direct opponent.
In a nutshell, what should we look for during the electoral night? Our impression is that a decisive push for or against the Conservatives will come from Scotland, where it seems that the Tories might take some seats away from the SNP, and from London, in whose seats the Labour party could outperform the Conservative party. On Friday, quoting a popular hashtag on Twitter, we will see whether the British people will “make June the end of May”.
[1] https://yougov.co.uk/uk-general-election-2017/ . Our analysis is based on YouGov’s 1st June estimates. Notice that other polls show different estimates for the election, more favourable for the Conservative Party. Moreover, notice that the last available prediction by YouGov (4th June) is even more favourable for the Labour Party (the Conservatives should obtain 308 seats against the 261 seats which should be won by Corbyn’s party).
[2] The 18 seats of Northern Ireland have been excluded from this analysis given they are not taken into account in the YouGov’s estimates.
[3] Notice that 1 seat (Buckingham) is that of the current Speaker of the House of Commons, and traditionally the three main parties do not contest the election in the Speaker’ seat.
[4] The situation would only slightly change if also Playd Cymru and Greens would enter the Labour-led coalition: in this case the five-party coalition would fall short of a majority by 16 seats (310 out of 326).