Autore: Arjan Schakel

  • Europee Paesi Bassi: un effetto dello Spitzenkandidat Timmermans?

    Europee Paesi Bassi: un effetto dello Spitzenkandidat Timmermans?

    Traduzione di Giorgia Ramazzotti.

    Introduzione

    Paesi Bassi e il Regno Unito sono stati i primi stati membri ad andare al voto martedì 23 maggio 2019, prima degli altri stati membri dell’Unione Europea (UE), che li hanno seguiti il 24 maggio o più tardi. Ci si poteva attendere che il voto in Olanda e Regno Unito avrebbe gettato un’ombra di euroscetticismo sulle elezioni del PE tenute nei giorni a seguire nei 26 stati membri rimanenti, ma non è stato così in Olanda. In realtà, è avvenuto il contrario. Il grande vincitore è stato l’europeista Partito del Lavoro (PvdA) che ha vinto la maggiore percentuale di voti con il 18,9%, 9,5 punti in più rispetto alle elezioni del PE 2014. Il nuovo arrivato e fortemente antieuropeista Forum per la Democrazia (FvD) ha ottenuto il 10,9% dei voti ma questo successo ha avuto conseguenze negative sull’altrettanto antieuropeista Partito della Libertà (PVV), fermo all’8,9% (Tabella 1). Frans Timmermans – primo vice presidente della Commissione Europea – era il candidato leader del PvdA e lo Spitzenkandidat per il gruppo parlamentare del PE Socialisti e Democratici (S&D). Lo Spitzenkandidat (candidato leader per la posizione di presidente della Commissione Europea) è una novità nell’arena elettorale europea introdotta con le elezioni europee del 2014 in un tentativo di aumentare l’interesse e la partecipazione alle elezioni europee. In questo saggio si tenterà di comprendere quanto il risultato delle elezioni europee olandesi possano essere spiegate dall’effetto Timmermans o spitzenkandidat.

    Nella prossima sezione verranno discussi brevemente i programmi di partito di tutti i partiti e le tematiche principali della campagna. Nella terza sezione confronterò i risultati delle elezioni del PE 2019 con le precedenti elezioni nazionali (2012 e 2017), provinciali (2015 e 2019) ed europee (2014); questo consentirà di analizzare quanto i risultati delle elezioni del PE 2019 possano essere spiegate dalla crescente importanza dell’UE (gli slittamenti di voto dai partiti europeisti agli antieuropeisti), dalla natura di secondo ordine delle elezioni europee (gli slittamenti di voto da partiti al governo ai partiti di opposizione) o, invece, dall’effetto Timmermans. La sezione finale presenta una breve discussione.

    Tab. 1 – Risultati delle elezioni per il Parlamento Europeo del 2019: Paesi Bassi
    Partito Gruppo parlamentare Voti (VA) Seggi Differenza di voti dal 2014 (PP) Differenza di seggi dal 2014
    Partito Laburista (PvdA) S&D 18,9 6 +9,5 +3
    Partito Popolare per la Libertà e la Democrazia (VVD) ALDE 14,6 4 +2,6 -1
    Appello Cristiano Democratico (CDA) EPP 12,1 4 -3,1 +1
    Forum per la Democrazia (FvD) ECR 10,9 3 +10,9 +3
    Sinistra Verde (GL) G-EFA 10,9 3 +3,9 +1
    Democratici 66 (D66) ALDE 7,0 2 -8,5 -2
    Unione Cristiana (CU) – Partito Politico Riformato (SGP) ECR 6,8 2 -1,0 +0
    Party per gli Animali (PvdD) GUE-NGL 4,0 1 -0,2 +0
    50Plus (50+) 3,9 1 +0,2 +1
    Partito per la Libertà (PVV) NI 3,5 0 -9,8 +0
    Partito Socialista (SP) GUE-NGL 3,4 0 -6,2 +0
    Volt Paesi Bassi (VN) 1,9 0 +1,9 +0
    DENK 1,1 0 +1,1 +0
    Altri partiti 1,0 0 -1,3 +0
    Totale 100 26
    Affluenza (%) 41,9 +4,6
    Soglia legale di sbarramento (%) Nessuna (soglia implicita=3,85%)

    Fonti: Parlamento Europeo (2019), NOS (2019).

    La campagna elettorale

    Ad eccezione del PVV e della lista pan-europeista VN tutti i partiti hanno prodotto dei lunghi programmi per le elezioni europee. Il PVV è assolutamente antieuropeista, come sottolineato in una frase del suo programma, lungo una sola pagina: L’Olanda di nuovo indipendente. Quindi fuori dall’UE (Nederland weer onafhankelijk. Dus uit de EU) (PVV, 2019). FvD è similmente antieuropeista ma il partito vuole tenere un referendum sull’appartenenza all’UE (FvD 2019). Dall’altro lato dello spettro c’è D&S che ha fatto campagna con lo slogan ‘In Europa formiamo il nostro futuro’ (In Europa maken we de toekomst) (D66, 2019), GL che ha introdotto il proprio programma elettorale con la frase ‘L’Unione Europea è indispensabile’ (De Europese Unie is onmisbaar) (GL, 2019), e il partito paneuropeo VN (VN 2019). Tutti gli altri partiti possono essere posizionati tra questi due estremi dal momento che assumono un approccio ‘europeista’ (Vollaard et al., 2016). Questi partiti sono a favore di una collaborazione tra gli stati membri dell’Unione su temi come l’immigrazione, il mercato unico e la sicurezza (CDA, 2019; PvdA, 2019), nonostante alcuni di loro siano chiaramente contro l’estensione e l’ulteriore integrazione dell’EU (CU-SGP, 2019; SP, 2019; VVD, 2019). Alcuni partiti più piccoli non sono antieuropeisti ma vorrebbero riformare significativamente l’UE e vorrebbero che l’UE adottasse particolari policies per ciò che riguarda il benessere degli animali, la cura degli anziani, la protezione dell’ambiente o il consolidamento di una società multiculturale (50Plus, 2019; DENK, 2019; PvdD, 2019).

    Non è usuale per i partiti politici olandesi scegliere delle figure politiche chiave a guida delle liste dei partiti politici in un contesto di elezioni europee (Vollaard et al., 2016). Le elezioni del PE 2019 non sono state un’eccezione, con l’esclusione del PVdA la cui lista era guidata da Frans Timmermans che, con una lunga esperienza da membro del parlamento e da ex segretario di stato e ministro degli esteri (Parlement.com, 2019a), è un politico molto rinomato in Olanda. Nonostante la sua statura politica in Olanda e l’attenzione posta sulla sua partecipazione al dibattito Spitzenkandidaten tenutosi a Maastricht (NRC, 2019a; Trouw, 2019a; Volkskrant, 2019a), Timmermans non ha ricevuto molta copertura mediatica durante la campagna. Ad esempio, uno dei principali quotidiani ha pubblicato interviste con i numeri uno delle liste per FvD e D66 nella settimana finale della campagna (De Volkskrant, 2019b, 2019c). Un altro esempio è il dibattito testa a testa tra il presidente-ministro Mark Rutte (VVD) e Thierry Baudet (FvD) che è stato trasmesso in TV la sera prima del giorno delle elezioni e che ha attratto 1.5 milioni di spettatori (AD 2019, NU nl. 2019). Nonostante la limitata attenzione mediatica, il PvdA è diventato il chiaro vincitore delle elezioni del PE 2019 (Tabella 1), un dato che rende il risultato elettorale piuttosto importante perché non era previsto affatto dalle stime di sondaggio (Ipsos, 2019a; NRC, 2019b; Volkskrant, 2019d; Trouw, 2019b).

    Il risultato elettorale: l’aumento della rilevanza dell’UE, uno slittamento anti-governativo o l’effetto Timmermans?

    La Tabella 2 confronta i risultati delle elezioni europee 2019 con i risultati delle provinciali del 2015, le nazionali del 2012 e 2017 e le elezioni del PE 2014. Il confronto rivela quanto le elezioni europee 2019 si differenzino dagli altri tipi di elezioni e in relazione alle tendenze elettorali generali. Il successo del PvdA alle elezioni del PE del 2019 posiziona il partito vicino al livello di voti che ottenne alle elezioni nazionali del 2012. È troppo presto per dire se è l’inizio di un recupero ma il numero effettivo di partiti (ENP) –una misura che indica quanto è frammentato il voto tra i partiti e che prende in considerazione il numero e le proporzioni di voti ricevuti (Laakso and Taagepera, 1979)– indica che il voto non è diventato ulteriormente frammentato tra i partiti. Invece, bisogna guardare ai cambiamenti aggregati nelle preferenze di voto tra le elezioni per comprendere il risultato delle elezioni del PE 2019.

    Tab. 2 – Risultati elettorali dal 2012, valori percentuali sui voti validi

    Politiche Europee Provinciali Politiche Provinciali Europee
    12/9/12 22/5/14 18/5/15 15/3/17 20/3/19 23/5/19
    PVV 10,1 13,3 11,7 13,1 6,9 3,5
    FvD 1,8 14,5 10,9
    CU-SGP 5,2 7,8 7,5 5,5 7,6 6,8
    VVD 26,6 12,0 15,9 21,3 14,0 14,6
    CDA 8,5 15,2 14,7 12,4 11,1 12,1
    D66 8,0 15,5 12,5 12,2 7,8 7,0
    PvdA 24,8 9,4 10,1 5,7 8,5 19,0
    GL 2,3 7,0 5,4 9,1 10,8 10,9
    SP 9,7 9,6 11,7 9,1 5,9 3,4
    PvdD 1,9 4,2 3,5 3,2 4,4 4,0
    50Plus 1,9 3,7 3,4 3,1 3,6 3,9
    DENK 2,1 1,7 1,1
    Altri partiti 1,0 2,3 3,7 1,5 3,2 2,8
    Affluenza (%) 74,6 37,3 47,8 81,6 56,2 41,9
    ENEP[1] 5,9 8,9 8,9 8,4 10,4 8,9

    Fonti: Parliamento Europeo (2019), Kiesraad (2019), NOS (2019).

    La rilevanza dell’UE

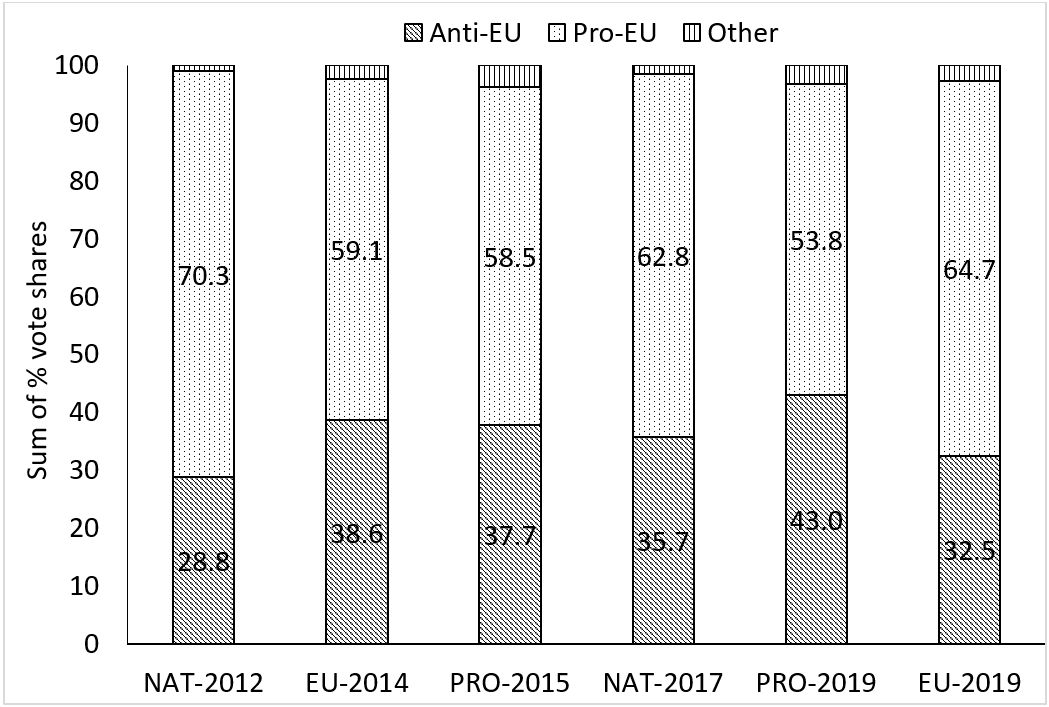
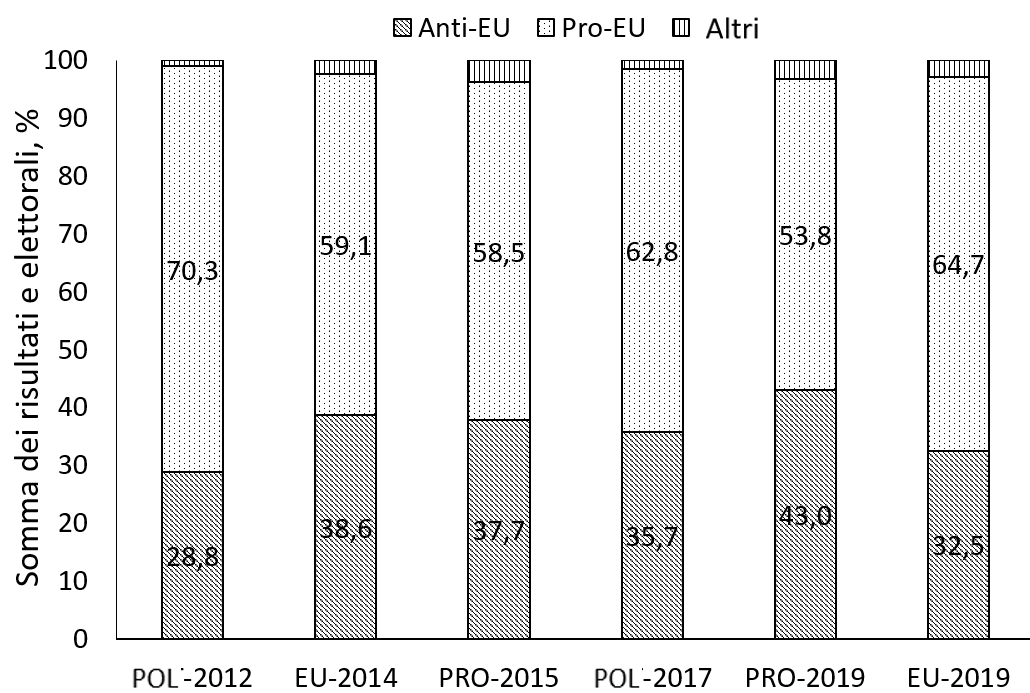
    La teoria della salienza dell’UE suggerirebbe che lo slittamento dei voti può essere attribuito ad un aumento della rilevanza dell’UE, che produce come risultato un’affluenza più alta e causa un movimento degli elettori dai partiti europeisti a quelli antieuropeisti, con l’eccezione dei Verdi che anche dovrebbero vincere una parte dei voti (Viola 2016). La Figura 1 mostra le percentuali di voto per i partiti antieuropeisti ed europeisti nelle elezioni nazionali, provinciali e europee dal 2012. Nelle elezioni del PE 2019 i partiti antieuropeisti hanno vinto una percentuale di voti complessiva del 32,5% che è piuttosto simile –entro una deviazione del 6%– alle percentuali combinate che questi partiti hanno ottenuto nelle precedenti elezioni europee, nazionali e provinciali, eccetto le provinciali del 2019. Un altro segno che l’aumento della rilevanza dell’UE non è un probabile fattore esplicativo è dato dai tassi di affluenza mostrati nella Tabella 2. Le elezioni del PE 2019 sono state segnate dall’affluenza più alta nelle elezioni europee degli ultimi venti anni, tuttavia in Olanda un’affluenza più alta è parte di una tendenza generale piuttosto che un segnale di aumento della rilevanza dell’UE. L’affluenza alle elezioni nazionali del 2017 è stata di 7 punti percentuali più alta di quella delle elezioni nazionali del 2012 e l’affluenza alle elezioni provinciali del 2019 è stata di 8,4 punti percentuali più alta rispetto alle elezioni provinciali del 2015. Al massimo, il piccolo aumento di 4,6 punti percentuali dell’affluenza alle elezioni del PE del 2019 rispetto alle elezioni europee del 2014 è segno di una bassa rilevanza. Infine, i partiti Verdi (GL e PydD) non hanno aumentato significativamente le loro percentuali di voto alle europee e alle provinciali del 2019 rispetto alle elezioni nazionali del 2017 (Tabella 2).

    Fig. 1 – Risultati elettorali per i partiti anti-UE e pro-UE nelle elezioni politiche, provinciali ed europee

    NL_1

    Slittamento anti-governativo

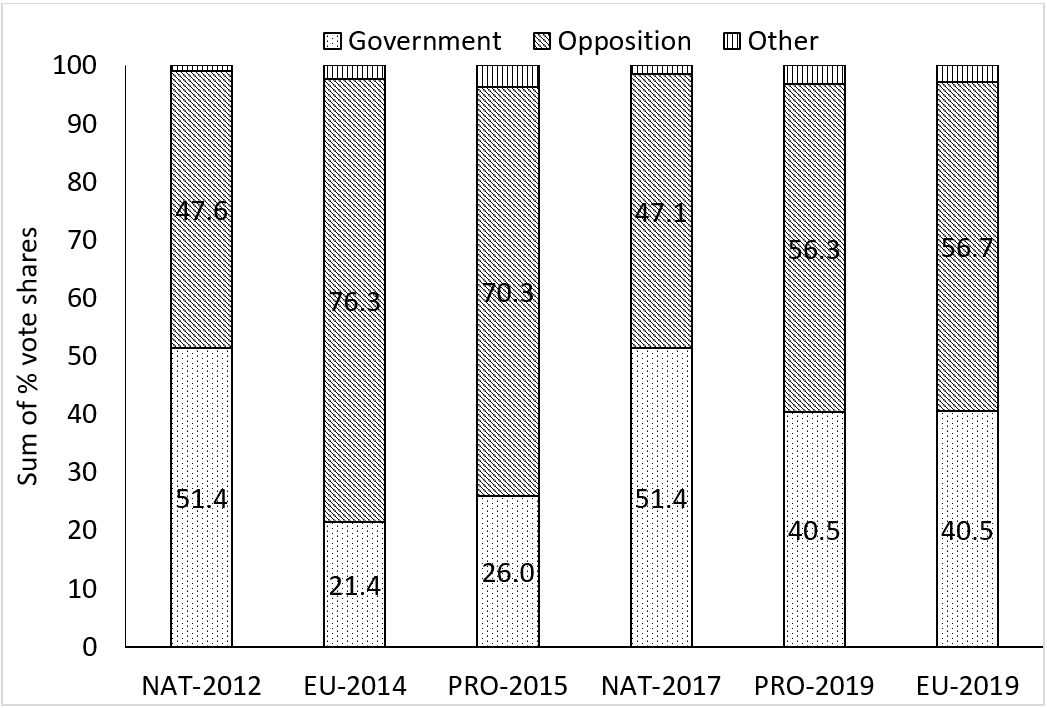
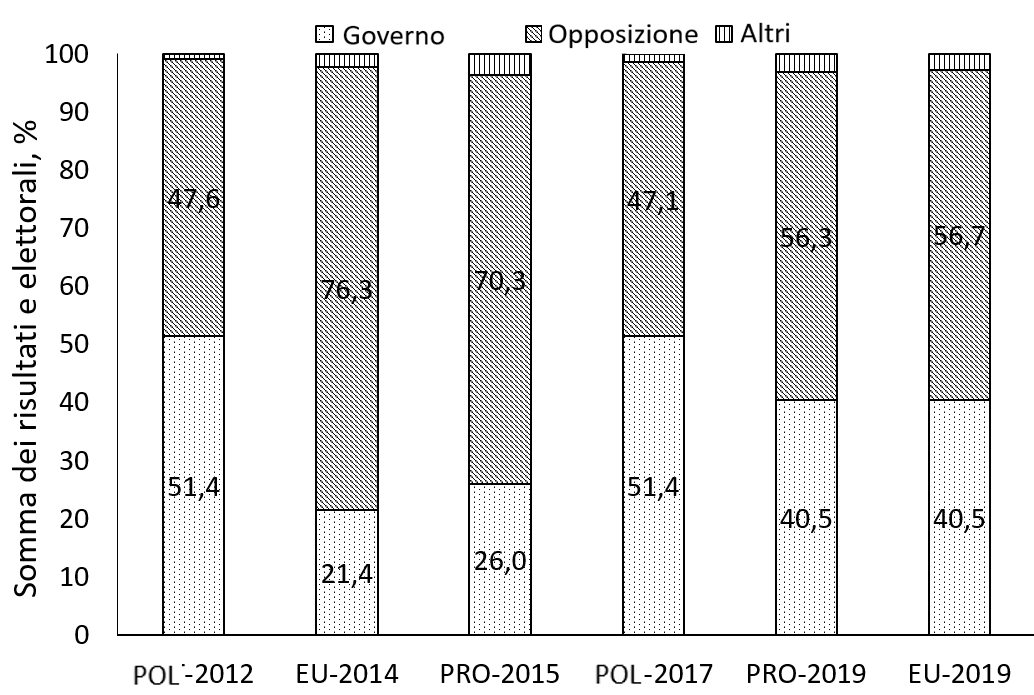
    Lo slittamento delle percentuali di voto può risultare da uno slittamento a sfavore del partito in carica al governo considerando che il PvdA è stato al governo nazionale da dopo le elezioni nazionali del 2012 ma all’opposizione da dopo le elezioni nazionali del 217. Il ‘voto punitivo’ per i partiti di governo nelle elezioni europee e sub-nazionali è attribuita alla natura di secondo ordine di queste elezioni (Viola 2016). Le elezioni nazionali di primo ordine sono concepite dagli elettori, i partiti e i media come contesti più importanti delle elezioni europee e sub-nazionali perché c’è di più ‘in gioco’ considerando che i governi nazionali prendono decisioni su questioni essenziali come le tasse, l’assistenza sociale, e la politica estera (Rei e Schmitt, 1980). La Figura 2 mostra le percentuali di complessive dei partiti al governo e dei partiti di opposizione nel le elezioni nazionali, provinciali ed europee dal 2012. I partiti di governo hanno ricevuto solo metà delle loro percentuali di voto del 2012 alle elezioni europee del 2014 e alle provinciali del 2015, cosa che indica che le elezioni europee e provinciali sono entrambe concepite come elezioni di secondo ordine. In questa luce, la perdita di dieci punti percentuali per i partiti di governo alle europee 2019 e alle elezioni provinciali rispetto alle elezioni nazionali del 2017, può essere considerata piuttosto modesta.

    Fig. 2 – Risultati elettorali per i partiti di governo e di opposizione nelle elezioni politiche, provinciali ed europee

    NL_2

    Effetto Timmermans (Spitzenkandidaten)

    Nonostante la tempistica ravvicinata delle elezioni provinciali ed europee del 2019, la Tabella 2 rivela slittamenti di voto aggregati significativi tra i partiti. Il grande vincitore delle elezioni provinciali del 2019 è stato FvD che ha ottenuto 12.8 punti percentuali in più rispetto alle elezioni nazionali del 2012. Più probabilmente, gli elettori si sono spostati dal VVD che ha perso 7.3 punti percentuali e dal PVV che ha perso 6.1 punti rispetto alle elezioni nazionali del 2012. Le elezioni provinciali e europee 2019 mostrano risultati piuttosto simili, a parte la straordinaria conquista del PvdA che passa dall’8,5 al 19,0%. I principali perdenti sono stati l’FvD (-3,6%), il PVV (-3,3%) e il SP (-2,5%), la cui perdita di -9,6 punti percentuali è vicina al guadagno di voti del PvdA di 10,5 punti. Questi spostamenti di voto sono segnali di un effetto spitzenkandidaten per cui Timmermans è stato capace di attrarre elettori dall’intero spettro politico?

    La Tabella 3 mostra le percentuali di voto delle elezioni tenutesi dal 2012 per gli otto partiti più grandi nella provincia di Limburg. Questa provincia è interessante perché è considerata come la ‘casa’ di Timmermans. Frans Timmermans è nato a Maastricht, la capitale di provincia di Limburg, ha frequentato la scuola secondaria a Heerlen (una città di Limburg) dove possiede ancora una casa, ed è stato candidato per diventare Commissario del Re della provincia di Limburg nel 2011 ma non ha ottenuto l’incarico (Parlement.com, 2019a). Frans Timmermans è conosciuto per essere poliglotta e oltre a parlare l’olandese e il dialetto di Limburg parla anche l’inglese, il francese, il tedesco, l’italiano ed il russo. È dichiaratamente un europeista unionista e ha lanciato la sua campagna come Spitzenkandidaten di S&D per le elezioni del PE 2019 a Herleen nella provincia di Limburg. Frans Timmermans ha chiaramente dato importanza durante la campagna a Limburg, una regione di confine dove storicamente si sono intrecciate le interazioni tra il Belgio e la Germania. Ad esempio, Timmermans ha iniziato il suo discorso di accettazione come candidato leader con dei riferimenti a suo nonno e al suo bisnonno che si trasferirono dalla Germania ad Heerlen per lavorare in miniera (Timmermans 2019).

    Tab. 3 – Risultati elettorali dal 2012 nel Limburgo, valori percentuali sui voti validi[2]

    Partito Politiche 2012 Europee 2014 Provinciali 2015 Politiche 2017 Provinciali 2019 Europee 2019
    PVV 17,7 20,8 17,8 19,6 13,6 6,2
    FvD 2,0 14,6 11,4
    VVD 22,7 20,8 11,5 17,9 10,2 8,9
    CDA 9,7 12,2 22,9 14,9 18,7 14,7
    PvdA 21,8 7,7 7,3 4,0 6,5 28,7
    D66 6,3 12,2 9,4 10,6 5,8 4,3
    GL 1,8 0,9 3,9 10,6 8,4 7,0
    SP 14,4 12,7 15,5 13,7 8,7 3,9
    Totale 94,4 87,2 88,4 93,3 86,4 85,2

    Fonti: Kiesraad (2019); nlverkiezingen.com (2019); NOS (2019).

    Dalla Tabella 3 si può osservare che gli otto maggiori partiti sono capaci di attrarre quasi il 95% del voto durante le elezioni nazionali ma che durante le elezioni europee e provinciali perdono collettivamente quasi il 10% dei voti (le percentuali sono rispettivamente 85,2% e 86,4%). Questo sottolinea la natura di secondo ordine di questi contesti in cui gli elettori tendono a supportare piccoli partiti e nuovi partiti perché si spostano dal voto strategico ad un voto sincero (Marsh e Mihaylov 2010). Gli elettori di Limburg si sono comportanti similmente agli elettori olandesi più in generale ma i cambiamenti di voto aggregato sono stati di maggiore entità. Ciò che si distingue nella Tabella 3 è che quando le elezioni provinciali ed europee vengono confrontate tra loro, le perdite di percentuali di voto per il PVV (-7,3), FvD (-3,1) , VVD (-1,2) CDA (-3,9) D66 (-1,5) e SP (-4,8) insieme totalizzano un -23,4% che è molto vicino al guadagno di 22,2 punti percentuali di PvdA. Nonostante la simile natura di elezioni di secondo ordine sia per le europee che per le provinciali 2019, si può osservare un chiaro effetto Timmermans (Spitzenkandidaten). In risposta alla domanda su quanto il capo della lista di partito fosse stato importante per la scelta di voto, non meno del 48% degli elettori di PvdA ha indicato che era importante mentre la seconda percentuale più alta è stato un magro 18% registrato per gli elettori di PVV (Ipsos, 2019b). Timmermans sembra essere stato capace di attrarre elettori da tutto lo spettro politico destra-sinistra e i suoi elettori sembrano meno preoccupati di punire i partiti al governo o di votare secondo la loro opinione sulle questioni dell’UE (vedi anche Ipsos, 2019b).

    Discussione

    L’analisi in questo contributo suggerisce chiaramente come l’effetto Timmermans (Spitzenkandidaten) abbia avuto un ruolo sui risultati delle elezioni 2019 del Parlamento Europeo in Olanda. La Tabella 3 rivela spostamenti significativi di voto a Limburg che non sono osservati nei dati nazionali aggregati (Tabella 2). Ad esempio, il PvdA ha perso il 14,1 punti percentuali quando le elezioni del PE 2014 si confrontano con le elezioni nazionali del 2012. I beneficiari sono stati il D66 (5,8%) e il PVV (3,1%). Spostamenti significativi di elettori sono individuabili anche quando le elezioni provinciali del 2015 si confrontano con le elezioni europee del 2014. In questo confronto il CDA è chiaramente il vincitore (10,8%) mentre il VVD è stato significativamente il perdente (9,2%). Sembra che gli elettori di Limburg (e di tutta l’Olanda, vedi Tabella 2) sia di sinistra sia di destra stiano fluttuando e possano essere mobilitati da un candidato attraente che raggiunge gli elettori portando avanti campagne locali (vedi anche Gatterman et al. 2016; Schmitt et al. 2015). Questa sarebbe un’ipotesi interessante da esplorare ulteriormente attraverso un’analisi dei sondaggi elettorali che permetterebbero di arrivare alle motivazioni che sottostanno alle scelte di voto.

    Riferimenti

    Braun, D. e Popa, S. A. (2018). This time it was different? The salience of the Spitzenkandidaten system among European parties. West European Politics, 41(5), 1125-1145.

    Gattermann, K., de Vreese, C. e van der Brug, W. (2016). Evaluations of the Spitzenkandidaten: The role of information and news exposure in citizens’ preference formation. Politics and Governance, 4(1), 37-54.

    Hobolt, S. B. (2014). A vote for the President? The role of Spitzenkandidaten in the 2014 European Parliament elections. Journal of European Public Policy, 21(10), 1528-1540.

    Ipsos (2019b). EP19. Verkiezingsonderzoek Ipsos in opdracht van de NOS. Amsterdam 29 mei 2019. Retrieved May 30, 2019 from: https://www.ipsos.com/sites/default/files/2019-05/19020845_ipsos_ep19_v1.3.pdf.

    Laakso, M. e Taagepera, R. (1979). Effective number of parties: A measure with Application to West Europe. Comparative Political Studies, 12(3), 3-27.

    Marsh, M. e Mihaylov, S. (2010). European Parliament elections and EU governance, Living Reviews in European Governance, 5(4). Retrieved from: https://www.livingreviews.org/lreg-2010-4.

    Reif, K. e Schmitt, H. (1980). Nine second-order national elections – A conceptual framework for the analysis of European election results. European Journal of Political Research, 8(10), 3-44.

    Schmitt, H., Hobolt, S. e Popa, S. A. (2015). Does personalization increase turnout? Spitzenkandidaten in the 2014 European Parliament elections. European Union Politics, 16(3), 347-368.

    Viola, D. M. (2016). European Parliament elections theories. In D. M. Viola (Ed.), Routledge handbook of European elections (39-48). London: Routledge.

    Vollaard, H., Voerman, G. e van de Waller, N. (2016). The Netherlands. In D. M. Viola (Ed.), Routledge handbook of European elections (167-188). London: Routledge.

    European Union Election Party Manifestoes

    50Plus (50+) (2019). Onze toekomst in Europa. Solidair met jong en oud. Geef 50-plussers een stem in het Europees Parlement. Programma voor de 9e verkiezingen voor het Europees Parlement op 23 mei 2019. Retrieved from: https://50pluspartij.nl/images/2018/september_oktober/50PLU-verkiezingsprogramma-EP-20180917.pdf.

    ChristenUnie (CU) – Staatkundig Gereformeerde Partij (SGP) (2019). ‘Naar de kern’. Verkiezingsprogramma ChristenUnie en SGP Europees Parlement 2019-2024. Retrieved from: https://www.christenunie.nl/l/library/download/urn:uuid:3fe98a0a-377e-4a3b-90d9-9dae554dc2d3/verkiezingsprogramma+ep2019+online.pdf.

    Christen-Democratisch Appèl (CDA) (2019). Beschermen wat van waarde is. Daarom een sterk Europa. Europees verkiezingsprogramma 2019-2014. Retrieved from: https://d2vry01uvf8h31.cloudfront.net/CDA/Documenten/2019/CDAEUvkp%5B2019-2024%5D-digitaal_01.pdf.

    Democraten 66 (D66) (2019). In Europa maken we de toekomst. Definitief programma D66 verkiezingen Europees Parlement 2019. Retrieved from: https://verkiezingsprogramma.d66.nl/content/uploads/sites/45/2019/04/D66_verkiezingsprogramma_EP2019.pdf.

    Denk (DENK) (2019). Denkend aan Europa. Verkiezingsprogramma Europees Parlement 2019-2024. Retrieved from: https://denkeuropa.eu/Verkiezingsprogramma-Europees-Parlement-2019-2024.pdf.

    Forum voor Democratie (FvD) (2019). Waar staat het Forum voor Democratie in het politieke spectrum?. Retrieved from: https://forumvoordemocratie.nl/standpunten/europese-unie.

    GroenLinks (GL) (2019). Voor verandering. Verkiezingsprogramma Europese verkiezingen 2019. Retrieved from: https://groenlinks.nl/sites/groenlinks.nl/files/Europees_verkiezingsprogramma_2019%20%281%29.pdf.

    Partij van de Arbeid (PvdA) (2019). Zeker van een eerlijk, vrijd en duurzaam Europa. Verkiezingsprograma van de PvdA voor de Europese Parlementsverkiezingen 2019. Retrieved from: https://www.pvda.nl/wp-content/uploads/2019/02/EU-verkiezingsprogramma-DEF.pdf.

    Partij voor de Dieren (PvdD) (2019). Plan B voor Europa. Verkiezingsprogramma Europees Parlement 2019. Retrieved from: https://www.partijvoordedieren.nl/uploads/algemeen/PvdD-19.067-Verk.-progr.-EP-2019.pdf.

    Partij voor de Vrijheid (PVV) (2019). Nederland weer van ons! Concept – Verkiezingsprogramma PVV 2017-2021. Retrieved from: https://pvv.nl/visie.html.

    Socialistische Paritj (SP) (2019). Breek de macht van Brussel. Voor een rechtvaardige EU. Programma Europese verkiezingen 2019. Retrieved from: https://www.sp.nl/sites/default/files/breek_de_macht_van_brussel_0.pdf.

    Volt Nederland (VN) (2019). De 5 Hoofdstandpunten. Retrieved from: https://www.voltnederland.org/standpunten.

    Volkspartij voor Vrijheid en Democratie (VVD) (2019). Focus en Leef. Voor een sterk Nederland in een veilig Europa. Verkiezingsprogramma Europees Parlement 2019. Retrieved from: https://www.vvd.nl/verkiezingsprogramma_s/.

    Siti web

    AD (2019, May 23). Helft TV-kijkers stemt af op debat Baudet versus Rutte. Retrieved from: https://www.ad.nl/show/helft-tv-kijkers-stemt-af-op-debat-baudet-versus-rutte~a7c87941/.

    CBS (2019). Centraal Bureau voor de Statistiek. StatLine. Retrieved from: https://statline.cbs.nl/Statweb/default.aspx

    CHES (2019). Chapel Hill Expert Survey Dataset. Retrieved from: https://www.chesdata.eu/ches-stats.

    European Parliament (2019). 2019 European election results. Retrieved from: https://election-results.eu/national-results/netherlands/2019-2024/.

    Ipsos (2019a). Politieke barometer week 21. Retrieved from: https://www.ipsos.com/nl-nl/politieke-barometer-week-21.

    Kiesraad (2019). Databank Verkiezingsuitslagen. Retrieved from: https://www.verkiezingsuitslagen.nl/verkiezingen.

    nlverkiezingen.com (2019). Nederlandse verkiezingsuitslagen 1918-nu. Retrieved from: https://www.nlverkiezingen.com.

    NOS (2019a). Bekijk hier alle uitslagen van de EU-verkiezingen. Retrieved from: https://nos.nl/artikel/2285797-bekijk-hier-alle-uitslagen-van-de-eu-verkiezingen.html.

    NRC (2019a, April 29). Campagne voeren zonder de grote concurrent. Retrieved from: https://www.nrc.nl/nieuws/2019/04/29/debat-zonder-de-grote-concurrent-a3958576.

    NRC (2019b, May 23). PvdA wordt onverwacht de grootste. Retrieved from: https://www.nrc.nl/nieuws/2019/05/23/pvda-wordt-onverwacht-de-grootste-a3961417.

    NU.nl (2019, May 23). Anderhalf miljoen kijkers voor debat tussen Bauder en Ruttue in Pauw. Retrieved from: https://www.nu.nl/media/5905041/anderhalf-miljoen-kijkers-voor-debat-tussen-baudet-en-rutte-in-pauw.html.

    Parlement.com (2019a). Parlement.com. Retrieved from: https://www.parlement.com/id/vg09llk9rzrp/f_c_g_m_frans_timmermans

    Parlement.com (2019b). Parlement.com. Retrieved from: https://www.parlement.com/id/vh8lnhrp1x03/kabinetten_1945_heden.

    Timmermans, F. (2019). Kandidaatsspeech Frans Timmermans. Spoken out on Wednesday 10 October 2018. Retrieved from: https://www.pvda.nl/politici/frans-timmermans/.

    Trouw (2019a, April 29). Nederlanders voeren boventoon in eerste Europees verkiezingsdebat. Retrieved from: https://www.trouw.nl/democratie/nederlanders-voeren-boventoon-in-eerste-europees-verkiezingsdebat~a1a7eb9d/.

    Trouw (2019b, May 23). Het Timmermanswonder maakt van de PvdA de grote Winnaar. Retrieved from: https://www.trouw.nl/democratie/het-timmermanswonder-maakt-van-pvda-onverwacht-de-grote-winnaar-~a2303790/.

    Volkskrant (2019a, April 29). Het eerste debat tussen lijsttrekkers is symbolisch foor de Europese politiek. Retrieved from: https://www.volkskrant.nl/nieuws-achtergrond/het-eerste-debat-tussen-lijsttrekkers-is-symbolisch-voor-de-europese-politiek~b7350fd6/.

    Volkskrant (2019b, May 17). De Europese Unie is het vehikel van onze soevereiniteit. Retrieved from: https://www.volkskrant.nl/nieuws-achtergrond/de-europese-unie-is-het-vehikel-van-onze-soevereiniteit~b5daf610/.

    Volkskrant (2019c, May 17). Als we doorgaan op deze weg, is de Unie ten dode opgeschreven. Retrieved from: https://www.volkskrant.nl/nieuws-achtergrond/als-we-doorgaan-op-deze-weg-is-de-unie-ten-dode-opgeschreven~ba7ca971/.

    Volkskrant (2019d, May 24). Wat zit er achter het Timmermans-effect?. Retrieved from: https://www.volkskrant.nl/nieuws-achtergrond/wat-zit-er-achter-het-timmermans-effect~bccb88d5/.


    [1] Laakso and Taagepera (1979)

    [2] Le quote di voto delle europee 2019 sono stimate sulla base delle percentuali di voto nei comuni (N = 31), ponderate per la dimensione demografica del comune e l’affluenza alle urne.

  • Netherlands: A Timmermans (Spitzenkandidaten) Effect?

    Netherlands: A Timmermans (Spitzenkandidaten) Effect?


    Introduction

    The Netherlands and the United Kingdom were the first member states to hold European elections on Thursday 23 May 2019 ahead of other European Union (EU) member states which followed on 24 May or later. One may have expected that the Netherlands and the UK would set a ‘Eurosceptic’ cast over the EP elections to be held in the remaining 26 EU member states but this was not the case for the Netherlands. Actually, quite the opposite happened. The big winner was the pro-EU Labour Party (PvdA) which won the largest vote share of 18.9 per cent, up 9.5 per cent compared to the 2014 EP elections. Newcomer and stanch anti-EU party Forum for Democracy (FvD) won 10.9 percent of the votes but its support was mirrored by a significant vote share loss of 9.8 percent of the equally standfast anti-EU Party of the Freedom (PVV) (Table 1). Frans Timmermans –First Vice President of the European Commission– was lead candidate for the PvdA and he was the Spitzenkandidat for the EP party group Socialist and Democrats (S&D). Spitzenkandidaten (lead candidates for the position of President of the European Commission) are a novelty in the European electoral arena and were introduced with the 2014 European elections in an effort to increase interest and participation in European elections (Braun and Popa, 2018; Hobolt, 2014). In this chapter I will explore in how far the Dutch 2019 European election result can be explained by a ‘Timmermans’ or Spitzenkandidaten effect.

    In the next section I will briefly discuss the European party manifestos of the parties and the campaign. In the third section I will compare the outcomes of the 2019 EP elections to previously held national (2012 and 2017), provincial (2015 and 2019), as well as European (2014) elections which enables me to analyze in how far the 2019 EP election results can be explained by increasing EU salience (vote share swings from pro- to anti-EU parties), ‘second-orderness’ of EU elections (vote share swings from parties in national government to opposition parties), or, indeed, a ‘Timmermans effect’. The final section offers a short discussion.


    Table 1. Results of the 2019 European Parliament elections: the Netherlands.

    Party EP Group Votes (%) Seats Votes change from 2014 (%) Seats change from 2014
    Labour Party (PvdA) S&D 18.9 6 +9.5 +3
    People’s Party for Freedom and Democracy (VVD) ALDE 14.6 4 +2.6 -1
    Christian Democratic Appeal (CDA) EPP 12.1 4 -3.1 +1
    Forum for Democracy (FvD) ECR 10.9 3 +10.9 +3
    Green Left (GL) G-EFA 10.9 3 +3.9 +1
    Democrats 66 (D66) ALDE 7.0 2 -8.5 -2
    Christian Union (CU) – Reformed Political Party (SGP) ECR 6.8 2 -1.0 +0
    Party for the Animals (PvdD) GUE-NGL 4.0 1 -0.2 +0
    50 Plus (50+) 3.9 1 +0.2 +1
    Party for Freedom (PVV) NI 3.5 0 -9.8 +0
    Socialist Party (SP) GUE-NGL 3.4 0 -6.2 +0
    Volt Netherlands (VN) 1.9 0 +1.9 +0
    Think (DENK) 1.1 0 +1.1 +0
    Others 1.0 0 -1.3 +0
    Total 100 26
    Turnout (%) 41.9 +4.6
    Legal threshold for obtaining MEPs (%) None (effective threshold of 3.85%)

    Sources: European Parliament (2019), NOS (2019).


    The Campaign

    Except for the PVV and the pan-European list VN all parties produced lengthy party manifestoes for the European elections. The PVV is downright Eurosceptic which is noted down in one sentence on their one-page election manifesto: ‘The Netherlands independent again. Thus out of the EU.’ (Nederland weer onafhankelijk. Dus uit de EU) (PVV, 2019). FvD is similarly anti-EU but the party wants to hold a referendum on EU membership (FvD, 2019). On the other side of the spectrum stands D66 which campaigned with the slogan ‘In Europe we make our future’ (In Europa maken we de toekomst) (D66, 2019), GL which started its election manifesto with the sentence ‘The European Union is indispensable’ (De Europese Unie is onmisbaar) (GL, 2019), and the pan-European party VN (VN, 2019). All other parties can be placed in between these two extremes as they take a ‘Euro-realist’ approach (Vollaard et al., 2016). These parties are in favour of collaboration between EU member states on issues such as immigration, single market, and security (CDA, 2019; PvdA, 2019) although some of them are clearly against a widening and deepening EU (CU-SGP, 2019; SP, 2019; VVD, 2019). Other smaller parties are not anti-EU either but would like to significantly reform the EU and would like the EU to take action in particular policies such as animal welfare, the elderly, the environment, or the multicultural society (50Plus, 2019; DENK, 2019; PvdD, 2019).

    It is not customary for Dutch political parties to choose key political figures to head their European election party lists (Vollaard et al., 2016). The 2019 EP elections were not an exception bar the PvdA which list was headed by Frans Timmermans who, as a long-serving member of parliament and former state secretary and minister for foreign affairs (Parlement.com, 2019a), is a well-known politician in the Netherlands. Despite his political stature in the Netherlands and some attention paid to his participation in the Spitzenkandidaten debate held in Maastricht (NRC, 2019a; Trouw, 2019a; Volkskrant, 2019a), Timmermans did not receive much media coverage during the campaign. For example, one of the main daily newspapers featured interviews with the numbers one on the lists for FvD and D66 in the final week of the campaign (De Volkskrant, 2019b, 2019c). Another example is the ‘head-to-head’ debate between minister-president Mark Rutte (VVD) and Thierry Baudet (FvD) which was broadcasted on TV on the evening before election day and which attracted 1.5 million viewers (AD, 2019; NU.nl, 2019). Despite receiving limited media attention, the PvdA became the clear winner of the 2019 EP elections (Table 1) which makes the election outcome quite remarkable also because it was not foreseen at all in the public opinion polls (Ipsos, 2019a; NRC, 2019b; Volkskrant, 2019d; Trouw, 2019b).

    The Election Outcome: increasing EU salience, an anti-government swing, or a Timmermans effect?

    Table 2 compares the 2019 European election results to the outcomes of the 2015 and 2019 provincial, the 2012 and 2017 national, and the 2014 EP elections. The comparison reveals in how far the 2019 European elections stand out to other types of elections and in relation to overall electoral trends. The success of the PvdA in the 2019 EP elections puts the party close to the level of vote share it won in the 2012 national elections. It is too early to tell whether it is the start of a recuperation but the effective number of parties (ENP) –a measurement that indicates in how far the vote is fragmented across parties which takes into account the number and received vote shares of parties (Laakso and Taagepera, 1979)– indicates that the vote has not become further shattered across parties. Instead, one needs to look at aggregate movements in voter preferences across elections to gain insight into the 2019 EP election outcome.


    Table 2. Election results since 2012.

    National European Provincial National Provincial European
    12-Sep-12 22-May-14 18-Mar-15 15-Mar-17 20-Mar-19 23-May-19
    PVV 10.1 13.3 11.7 13.1 6.9 3.5
    FvD 1.8 14.5 10.9
    CU-SGP 5.2 7.8 7.5 5.5 7.6 6.8
    VVD 26.6 12.0 15.9 21.3 14.0 14.6
    CDA 8.5 15.2 14.7 12.4 11.1 12.1
    D66 8.0 15.5 12.5 12.2 7.8 7.0
    PvdA 24.8 9.4 10.1 5.7 8.5 19.0
    GL 2.3 7.0 5.4 9.1 10.8 10.9
    SP 9.7 9.6 11.7 9.1 5.9 3.4
    PvdD 1.9 4.2 3.5 3.2 4.4 4.0
    50Plus 1.9 3.7 3.4 3.1 3.6 3.9
    DENK 2.1 1.7 1.1
    Other 1.0 2.3 3.7 1.5 3.2 2.8
    Turnout 74.6 37.3 47.8 81.6 56.2 41.9
    ENEP 5.9 8.9 8.9 8.4 10.4 8.9

    Notes: ENEP = effective number of parties (Laakso and Taagepera (1979). NAT = national; EP = European Parliament; PRO = provincial.

    Sources: European Parliament (2019), Kiesraad (2019), NOS (2019).


    EU salience

    EU salience theory would predict that vote share swings can be attributed to an increase in EU saliency which results in higher turnout and triggers a move from pro-EU to anti-EU parties except for Green parties which should also win vote share (Viola, 2016). Figure 1 displays combined vote shares for anti-EU and pro-EU parties across national, provincial and European elections since 2012. In the 2019 EP elections anti-EU parties won a combined vote share of 32.5 per cent which is rather similar – within six per cent deviation – to the combined vote shares these parties received in previous European, national, and provincial elections except for the 2019 provincial elections. Another indication that an increase in EU salience is not a likely explanatory factor is given by the turnout rates displayed in Table 2. The 2019 EP elections were marked by the highest turnout in European elections over the past twenty years, however, in the Netherlands higher turnout is part of a general trend rather than an indication for increased EU salience. Turnout in the 2017 national election was 7.0 per cent higher than for the 2012 national election and turnout in the 2019 provincial election was 8.4 per cent higher compared to the 2015 provincial election. (salkantaytrekking.com) If anything, the mere 4.6 per cent increase turnout for the 2019 EP election compared to the 2014 European election is an indication for low salience. Finally, the Green parties (GL and PvdD) did not significantly increase their 2019 European and provincial vote shares compared to the 2017 national election (Table 2).


    Figure 1. Vote shares for anti-EU and pro-EU parties across national, provincial and European elections.

    arjan 1

    Notes: Anti-/pro-EU parties are classified according expert ratings on the position of the party leadership in 2014 on whether the Netherlands has benefited from being a member of the EU (1 = benefited; 2 = neither benefited nor lost; 3 = not benefited). Anti-EU parties (average experts score above 2.5): CU-SGP, FvD, PVV, PvdD, SP, 50Plus. Pro-EU parties (average expert score below 1.1): CDA, D66, GL, PvdA, VVD, DENK. FvD and DENK are classified by the author. Other parties: same as for Table 1.

    Source: CHES (2019).


    Anti-government swing

    The vote share swings could result from an anti-incumbency swing considering that the PvdA was in national government after the 2012 national election but in opposition after the 2017 national election. The ‘punishment vote’ for government parties in European and subnational elections is attributed to the second-order nature of these elections (Viola, 2016). First-order national elections are conceived by voters, parties, and the media as more important contests than European and subnational elections because more is ‘at stake’ considering that national governments take decisions on essential issues such as taxes, the welfare state, and foreign policy (Reif and Schmitt, 1980). Figure 2 displays combined vote shares for parties in national government and opposition parties across national, provincial and European elections since 2012. Government parties received only half of their 2012 national vote shares in the 2014 European and 2015 provincial elections indicating that European and provincial elections are both conceived to be second-order elections. In this light, the ten per cent vote share loss for government parties in the 2019 European and provincial elections compared to 2017 national election can be considered to be quite modest.


    Figure 2. Vote shares for parties in national government and opposition parties across national, provincial and European elections.

    arjan 2

    Notes: Government parties are parties that form the executive at the national level: VVD and PvdA in 2012 and VVD, D66, CDA, and ChristenUnie in 2017. Opposition parties won seats in national parliament (Tweede Kamer) but do not partake in or provide support to the national government. Other parties: same as for Table 1.

    Source: Parlement.com (2019b).


    Timmermans (Spitzenkandidaten) effect

    Despite the close timing of the 2019 provincial and European elections, Table 2 reveals significant aggregate vote share swings between parties. The big winner of the 2019 provincial election was FvD which won 12.8 per cent compared to the 2012 national election. Most likely, voters moved from the VVD which lost 7.3 per cent and the PVV which lost 6.1 per cent vote share compared to the 2012 national election. The 2019 provincial and European elections display quite comparable results except for the tremendous gain for the PvdA from 8.5 to 19.0 per cent of the vote share. The main losers were FvD (-3.6%), PVV (-3.4%), and the SP (-2.5%) which combined vote share loss of -9.6 per cent comes close to PvdA’s vote share gain of 10.5 per cent. Are these vote share swings an indication of a Spitzenkandidaten effect whereby Timmermans was able to attract voters from across the whole political spectrum?

    Table 3 presents vote shares for elections held since 2012 for the eight largest parties in the province of Limburg. This province is interesting because it is considered to be ‘the home’ of Timmermans. Frans Timmermans was born in Maastricht, the provincial capital of Limburg, went through secondary education in Heerlen (a city in Limburg) where he still has a house, and he was a candidate to become Commissioner of the King of the province Limburg in 2011 but he did not get this office (Parlement.com, 2019a). Frans Timmermans is known to be a polyglot and apart from mastering Dutch and the Limburgs dialect he also speaks English, French, German, Italian, and Russian. He is an outspoken ‘pro-European Unionist’ and he launched his campaign as the S&D Spitzenkandidat for the 2019 EP elections in Heerlen in the province of Limburg. Frans Timmermans clearly gave his campaign a Limburg-twist, a border province where historically a lot of cross-border interactions with Belgium and Germany have taken place. For example, Timmermans started his acceptance speech as lead candidate with references to his grandfather and his great-grandfather who moved from Germany to Heerlen to work in the mines (Timmermans, 2019).


    Table 3. Election results (per cent vote share) for eight major parties in Limburg.

    Party NAT-2012 EP-2014 PRO-2015 NAT-2017 PRO-2019 EP-2019
    PVV 17.7 20.8 17.8 19.6 13.6 6.2
    FvD 2.0 14.6 11.4
    VVD 22.7 20.8 11.5 17.9 10.2 8.9
    CDA 9.7 12.2 22.9 14.9 18.7 14.7
    PvdA 21.8 7.7 7.3 4.0 6.5 28.7
    D66 6.3 12.2 9.4 10.6 5.8 4.3
    GL 1.8 0.9 3.9 10.6 8.4 7.0
    SP 14.4 12.7 15.5 13.7 8.7 3.9
    Total 94.4 87.2 88.4 93.3 86.4 85.2

    Notes: The EP-2019 vote shares are estimated on the basis of municipal vote percentages (N =31) weighted by population size and turnout. NAT = national; EP = European Parliament; PRO = provincial.

    Sources: Kiesraad (2019); nlverkiezingen.com (2019); NOS (2019).


    From Table 3 one may observe that the eight major parties are able to attract almost 95 per cent of the vote during national elections but that during European and provincial elections they collectively lose almost up to ten per cent vote share (vote share totals are respectively 85.2 and 86.4 per cent). This highlights the second-order nature of these contests whereby voters are inclined to support small and new parties because they move from strategic to sincere voting (Marsh and Mihaylov, 2010). As observed in Table 2, the 2019 European elections are remarkable because of the tremendous vote share gain for the PvdA compared to previously held elections. Voters in Limburg behaved similarly to Dutch voters but the aggregate vote share swings are larger in magnitude. What stands out in Table 3 is that when the 2019 provincial and European elections are compared to each other, vote share losses for the PVV (-7.3), FvD (-3.1), VVD (-1.2), CDA (-3.9), D66 (-1.5), GL (-1.5), and SP (-4.8) total up to -23.4 per cent which is very close to the 22.2 per cent vote share gain for the PvdA. Despite the similar second-order election nature of both the European and provincial 2019 elections, a clear Timmermans (Spitzenkandidaten) effect can be observed. In response to the question in how far the head of the party list was important for their vote choice no less than 48 per cent of PvdA voters indicated that this was important whereas the second highest percentage was a mere 18 per cent recorded for PVV-voters (Ipsos, 2019b). Timmermans seems to have been able to attract voters from the whole left-right political spectrum and his voters seemed less concerned about punishing parties in national government or to vote according to their opinion on EU issues (see also Ipsos, 2019b).


    Discussion

    The analysis in this chapter clearly suggests that a Timmermans (Spitzenkandidaten) effect may underlie the outcomes of the 2019 elections to the European Parliament in the Netherlands. Table 3 reveals significant vote share swings in Limburg which are not observed for nationally aggregated data (Table 2). For example, the PvdA lost 14.1 per cent vote share when the 2014 EP election is compared to the 2012 national election. The beneficiaries were D66 (5.8 per cent) and the PVV (3.1 per cent). Significant voter movements are also detectable when the 2015 provincial election is compared to the 2014 European election. In this comparison the CDA is the clear winner (10.8 per cent) whereas the VVD was the significant loser (9.2 per cent). It seems that voters in Limburg (and in the Netherlands as a whole, see Table 2) from both the left and right on the political spectrum are floating around and that they can be attracted by an appealing candidate who reaches out to the voters by campaigning locally (see also Gatterman et al., 2016 and Schmitt et al., 2015). This would be an interesting hypothesis to explore further through election survey analysis which would allow to tap into voter motivations underlying party vote choice.


    References

    Braun, D. and Popa, S. A. (2018). This time it was different? The salience of the Spitzenkandidaten system among European parties. West European Politics, 41(5), 1125-1145.

    Gattermann, K., de Vreese, C. and van der Brug, W. (2016). Evaluations of the Spitzenkandidaten: The role of information and news exposure in citizens’ preference formation. Politics and Governance, 4(1), 37-54.

    Hobolt, S. B. (2014). A vote for the President? The role of Spitzenkandidaten in the 2014 European Parliament elections. Journal of European Public Policy, 21(10), 1528-1540.

    Ipsos (2019b). EP19. Verkiezingsonderzoek Ipsos in opdracht van de NOS. Amsterdam 29 mei 2019. Retrieved May 30, 2019 from: https://www.ipsos.com/sites/default/files/2019-05/19020845_ipsos_ep19_v1.3.pdf.

    Laakso, M. and Taagepera, R. (1979). Effective number of parties: A measure with Application to West Europe. Comparative Political Studies, 12(3), 3-27.

    Marsh, M. and Mihaylov, S. (2010). European Parliament elections and EU governance, Living Reviews in European Governance, 5(4). Retrieved from: https://www.livingreviews.org/lreg-2010-4.

    Reif, K. and Schmitt, H. (1980). Nine second-order national elections – A conceptual framework for the analysis of European election results. European Journal of Political Research, 8(10), 3-44.

    Schmitt, H., Hobolt, S. and Popa, S. A. (2015). Does personalization increase turnout? Spitzenkandidaten in the 2014 European Parliament elections. European Union Politics, 16(3), 347-368.

    Viola, D. M. (2016). European Parliament elections theories. In D. M. Viola (Ed.), Routledge handbook of European elections (39-48). London: Routledge.

    Vollaard, H., Voerman, G. and van de Waller, N. (2016). The Netherlands. In D. M. Viola (Ed.), Routledge handbook of European elections (167-188). London: Routledge.


    European Union Election Party Manifestoes

    (consulted 27-30 May 2019)

    50Plus (50+) (2019). Onze toekomst in Europa. Solidair met jong en oud. Geef 50-plussers een stem in het Europees Parlement. Programma voor de 9e verkiezingen voor het Europees Parlement op 23 mei 2019. Retrieved from: https://50pluspartij.nl/images/2018/september_oktober/50PLU-verkiezingsprogramma-EP-20180917.pdf.

    ChristenUnie (CU) – Staatkundig Gereformeerde Partij (SGP) (2019). ‘Naar de kern’. Verkiezingsprogramma ChristenUnie en SGP Europees Parlement 2019-2024. Retrieved from: https://www.christenunie.nl/l/library/download/urn:uuid:3fe98a0a-377e-4a3b-90d9-9dae554dc2d3/verkiezingsprogramma+ep2019+online.pdf.

    Christen-Democratisch Appèl (CDA) (2019). Beschermen wat van waarde is. Daarom een sterk Europa. Europees verkiezingsprogramma 2019-2014. Retrieved from: https://d2vry01uvf8h31.cloudfront.net/CDA/Documenten/2019/CDAEUvkp%5B2019-2024%5D-digitaal_01.pdf.

    Democraten 66 (D66) (2019). In Europa maken we de toekomst. Definitief programma D66 verkiezingen Europees Parlement 2019. Retrieved from: https://verkiezingsprogramma.d66.nl/content/uploads/sites/45/2019/04/D66_verkiezingsprogramma_EP2019.pdf.

    Denk (DENK) (2019). Denkend aan Europa. Verkiezingsprogramma Europees Parlement 2019-2024. Retrieved from: https://denkeuropa.eu/Verkiezingsprogramma-Europees-Parlement-2019-2024.pdf.

    Forum voor Democratie (FvD) (2019). Waar staat het Forum voor Democratie in het politieke spectrum?. Retrieved from: https://forumvoordemocratie.nl/standpunten/europese-unie.

    GroenLinks (GL) (2019). Voor verandering. Verkiezingsprogramma Europese verkiezingen 2019. Retrieved from: https://groenlinks.nl/sites/groenlinks.nl/files/Europees_verkiezingsprogramma_2019%20%281%29.pdf.

    Partij van de Arbeid (PvdA) (2019). Zeker van een eerlijk, vrijd en duurzaam Europa. Verkiezingsprograma van de PvdA voor de Europese Parlementsverkiezingen 2019. Retrieved from:  https://www.pvda.nl/wp-content/uploads/2019/02/EU-verkiezingsprogramma-DEF.pdf.

    Partij voor de Dieren (PvdD) (2019). Plan B voor Europa. Verkiezingsprogramma Europees Parlement 2019. Retrieved from: https://www.partijvoordedieren.nl/uploads/algemeen/PvdD-19.067-Verk.-progr.-EP-2019.pdf.

    Partij voor de Vrijheid (PVV) (2019). Nederland weer van ons! Concept – Verkiezingsprogramma PVV 2017-2021. Retrieved from: https://pvv.nl/visie.html.

    Socialistische Paritj (SP) (2019). Breek de macht van Brussel. Voor een rechtvaardige EU. Programma Europese verkiezingen 2019. Retrieved from: https://www.sp.nl/sites/default/files/breek_de_macht_van_brussel_0.pdf.

    Volt Nederland (VN) (2019). De 5 Hoofdstandpunten. Retrieved from: https://www.voltnederland.org/standpunten.

    Volkspartij voor Vrijheid en Democratie (VVD) (2019). Focus en Leef. Voor een sterk Nederland in een veilig Europa. Verkiezingsprogramma Europees Parlement 2019. Retrieved from: https://www.vvd.nl/verkiezingsprogramma_s/.


    Websites

    (consulted 27-30 May 2019)

    AD (2019, May 23). Helft TV-kijkers stemt af op debat Baudet versus Rutte. Retrieved from:  https://www.ad.nl/show/helft-tv-kijkers-stemt-af-op-debat-baudet-versus-rutte~a7c87941/.

    CBS (2019). Centraal Bureau voor de Statistiek. StatLine. Retrieved from: https://statline.cbs.nl/Statweb/default.aspx

    CHES (2019). Chapel Hill Expert Survey Dataset. Retrieved from: https://www.chesdata.eu/ches-stats.

    European Parliament (2019). 2019 European election results. Retrieved from:  https://election-results.eu/national-results/netherlands/2019-2024/.

    Ipsos (2019a). Politieke barometer week 21. Retrieved from: https://www.ipsos.com/nl-nl/politieke-barometer-week-21.

    Kiesraad (2019). Databank Verkiezingsuitslagen. Retrieved from: https://www.verkiezingsuitslagen.nl/verkiezingen.

    nlverkiezingen.com (2019). Nederlandse verkiezingsuitslagen 1918-nu. Retrieved from: https://www.nlverkiezingen.com.

    NOS (2019a). Bekijk hier alle uitslagen van de EU-verkiezingen. Retrieved from: https://nos.nl/artikel/2285797-bekijk-hier-alle-uitslagen-van-de-eu-verkiezingen.html.

    NRC (2019a, April 29). Campagne voeren zonder de grote concurrent. Retrieved from: https://www.nrc.nl/nieuws/2019/04/29/debat-zonder-de-grote-concurrent-a3958576.

    NRC (2019b, May 23). PvdA wordt onverwacht de grootste. Retrieved from: https://www.nrc.nl/nieuws/2019/05/23/pvda-wordt-onverwacht-de-grootste-a3961417.

    NU.nl (2019, May 23). Anderhalf miljoen kijkers voor debat tussen Bauder en Ruttue in Pauw. Retrieved from: https://www.nu.nl/media/5905041/anderhalf-miljoen-kijkers-voor-debat-tussen-baudet-en-rutte-in-pauw.html.

    Parlement.com (2019a). Parlement.com. Retrieved from:  https://www.parlement.com/id/vg09llk9rzrp/f_c_g_m_frans_timmermans

    Parlement.com (2019b). Parlement.com. Retrieved from: https://www.parlement.com/id/vh8lnhrp1x03/kabinetten_1945_heden.

    Timmermans, F. (2019). Kandidaatsspeech Frans Timmermans. Spoken out on Wednesday 10 October 2018. Retrieved from: https://www.pvda.nl/politici/frans-timmermans/.

    Trouw (2019a, April 29). Nederlanders voeren boventoon in eerste Europees verkiezingsdebat. Retrieved from: https://www.trouw.nl/democratie/nederlanders-voeren-boventoon-in-eerste-europees-verkiezingsdebat~a1a7eb9d/.

    Trouw (2019b, May 23). Het Timmermanswonder maakt van de PvdA de grote Winnaar. Retrieved from: https://www.trouw.nl/democratie/het-timmermanswonder-maakt-van-pvda-onverwacht-de-grote-winnaar-~a2303790/.

    Volkskrant (2019a, April 29). Het eerste debat tussen lijsttrekkers is symbolisch foor de Europese politiek. Retrieved from: https://www.volkskrant.nl/nieuws-achtergrond/het-eerste-debat-tussen-lijsttrekkers-is-symbolisch-voor-de-europese-politiek~b7350fd6/.

    Volkskrant (2019b, May 17). De Europese Unie is het vehikel van onze soevereiniteit. Retrieved from: https://www.volkskrant.nl/nieuws-achtergrond/de-europese-unie-is-het-vehikel-van-onze-soevereiniteit~b5daf610/.

    Volkskrant (2019c, May 17). Als we doorgaan op deze weg, is de Unie ten dode opgeschreven. Retrieved from: https://www.volkskrant.nl/nieuws-achtergrond/als-we-doorgaan-op-deze-weg-is-de-unie-ten-dode-opgeschreven~ba7ca971/.

    Volkskrant (2019d, May 24). Wat zit er achter het Timmermans-effect?. Retrieved from: https://www.volkskrant.nl/nieuws-achtergrond/wat-zit-er-achter-het-timmermans-effect~bccb88d5/.