




(English translation by Elisabetta Mannoni)
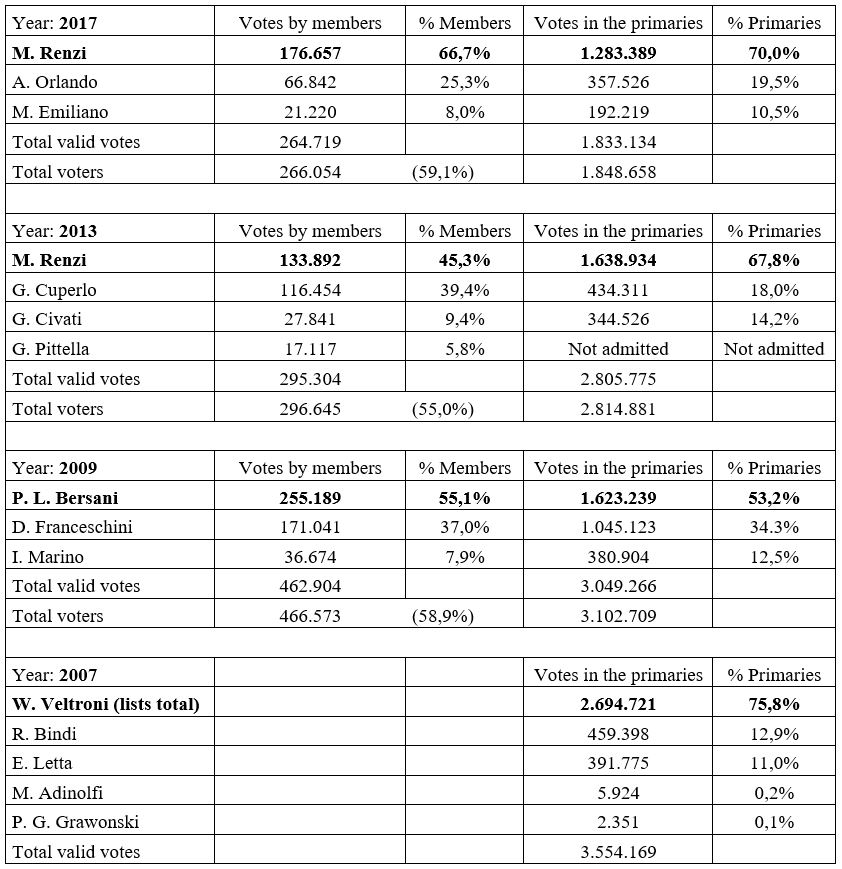
Matteo Renzi won the primaries of the Democratic Party, with an outstanding result (70%[1]) with respect to his two adversaries, the current Minister of Justice Andrea Orlando (19,5%) and the governor of Apulia Michele Emiliano (10,5%). A wide gap between the first and the second (50,5 percentage points), yet coherent with the gap registered in the previous primaries, between Renzi and Gianni Cuperlo (49,8). We can then confirm on the electorate what had already emerged in the vote by party members, held a few weeks ago: a dominant ex-Prime Minister over the other main competitors and a marginal so-called minority. On the one hand, the hierarchies within the PD have been re-established (after a moment of disequilibrium due to the defeat at the referendum and the sentence of the Constitutional Court on the electoral law), while, on the other, the party has been downsized, at least as for its majoritarian ambitions. Around 1.850.000 electors voted in this round: although according to a prudent estimation the threshold for this election to be considered satisfactory was set to one million votes, the PD lost around one million voters compared to four years ago.
The previous primaries
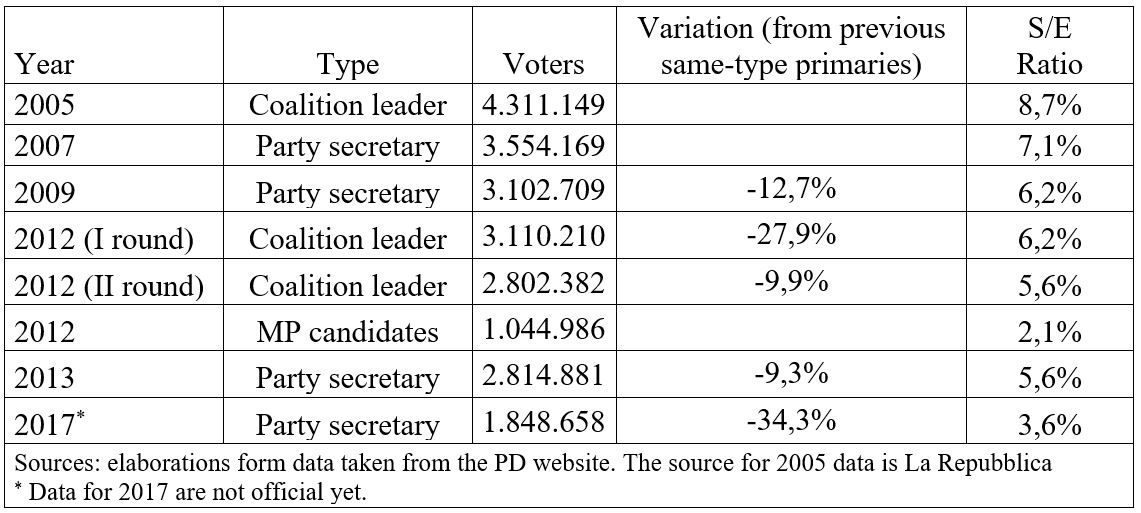
Table 1 shows the turnout in previous primaries for the selection of the secretary of the Democratic Party or of the candidate to the Prime Minister position, since 2007. If we put aside the 2005 round – a unicum, which can be explained by the new-factor on the national level (while primaries at the local level had already been introduced) and by the width of the centre-left coalition – the other primaries have gradually registered a progressively increasing demobilization of the electorate close to the PD and its allied parties. Almost the same can be said for the trend in party members (Table 2).
On a comparative perspective, the coalition primaries for the choice of the candidate to the Prime Minister position registered a decline of 28% from 2005 to the first round in 2012, and a decline of 35% from 2005 to the second round in 2012. Also in terms of electorate, the ratio between voters (selectors, ‘S’) and electors reduced over time – it was 8,7% in 2005 and 5,6% in 2012 second round. However, these two comparisons are less relevant than the data about turnout in the primaries for the choice of the secretary of the PD: even in this case, though, the PD registered a decrease in mobilization.
From 2007 and 2009, the decline in participation was 13%; from 2009 and 2013, the decline has decreased (-9%), but it did not stop. After four years, it is even stronger (-34%). It’s clear that both in 2007 and in 2013 the external environment – to use a weather metaphor, the ‘political climate’ – favoured the newbown party (2007) and Matteo Renzi’s new leadership (2013). In the latter case, the hard situation that the party faced during the period of grand-coalition government with the PDL (2011-2013), plus the PD disappointing result in the 2013 legislative elections, had favoured a change in party leadership, together with a strong message to scrap the previous political elite. The over 2,8 million voters who provided Renzi with a strong majority were in line with the party expectations. On the opposite, the PD that has just called the electorate to the polls is governing with its third Prime Minister in a four-year period; and, although the dissolution of the ‘Nazareno agreement’, Renzi’s resignation, and the subsequent split of a fraction of the party did not bring up great disequilibria within the government majority, they contributed in toning down the pre-vote enthusiasm. So, in the end, the party elite can consider the overall participation as partially satisfactory, if we take into account the discouraging premises.
Tab. 1 – Participation to PD primaries elections at the national level
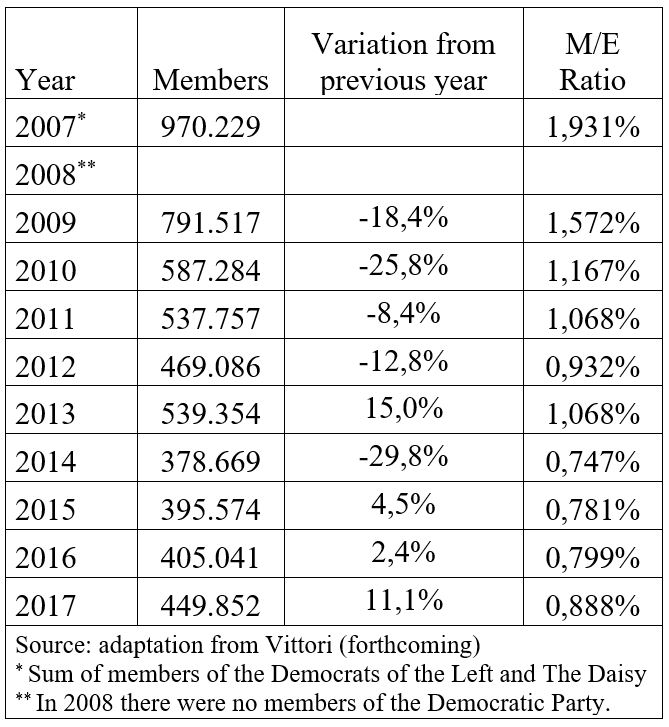
If we go forward in our analysis we can notice that – beyond the oscillations likely due to the non-uniqueness of the available data – the number of members of the party has progressively decreased throughout the ten years of PD history, with a slight upswing in most recent years. Compared to the previous Democrats of the Left and The Daisy, today the Democratic Party has lost more than 520.000 members, even though it got over 50.000 back from the lowest scored in 2014.
Tab. 2 – Members of the Democratic Party by year
We should highlight that the turnout rate this year in vote among party members was somewhat over 59% (266.054 expressed votes). Besides the numbers, the political data that emerged from members’ vote is the gap in percentage points between the first and the second candidate: both in 2009 and in 2013, Dario Franceschini and Gianni Cuperlo had abundantly exceeded 35% of valid preferences, showing a remarkable gap for the former (18 points) and a more restrained one for the latter (6%). This year, the gap between Renzi and Orlando in members’ vote has been 40 percentage points. This shows the non-competitiveness of the leadership from the various political tendencies – we better not call them factions – within the party. In absolute terms – and notwithstanding the 10% decline in participation from 2013 – Renzi increased his consensus among the members of more than 42.000 votes (+32%). In 2013, the gap between the members’ vote and the electorate’s had favoured Renzi – confirming the political interpretations according to which party members represent a more radical core of voters than the leadership and the electors; yet, on the one hand the 2017 primaries confirmed the greater appeal Renzi has on the electorate, and, on the other hand, it disproved what happened in 2013: it’s been the members who granted the new secretary a strong majority within the party. Although we lack recent longitudinal analyses about the evolution of PD members’ political preferences, a superficial analysis would reveal that there has been a relevant change with regard to Renzi, who is considered the most electorally-valuable candidate of the party, but also the most politically moderate and thus divisive towards potential allies on the left of the PD. The ‘firm’ the ex-secretary Bersani would often refer to, even if quantitatively reduced, has expressed its clear support to Renzi’s political project this time.
Tab. 3 – Results in vote by member and primaries for the election of the secretary of the Democratic Party.
The vote geography
A second and briefer analysis can be carried out on the vote geography. If we assume – and we can do it safely for speculation purposes – that the constitutional referendum has been a referendum on the Renzi cabinet, we should conclude that the South voted down the ex Prime Minister’s work. With a candidate like Michele Emiliano – not that competitive, but strongly rooted in the South and clearly hostile to Renzi – these tendencies should have been felt among the centre-left electors, too. But that was not the case: the results show that Renzi has been able to hold off the other competitors, even though Emiliano was the most-voted candidate in “his” Apulia, where he got 50% of the vote, and Renzi 35%. Although at the regional level data tend to be partial, once again the so-called Red Zone (Tuscany, Emilia-Romagna, the Marches, Umbria) confirms to be a stronghold for the PD: the four regions together got 515.000 electors, more than the 25% of the total.
Conclusions
The data of the PD primaries show a clear and constant decrease in participation and a low competitiveness among candidates, since the favoured candidate (Veltroni, Bersani and Renzi) has always won by large margins. However, the selection of the secretary and of the candidate-Prime Minister has got the attention of the centre-left electorate since the first experiment of national coalition primaries in 2005, enlarging the (formal) participation way beyond the simple members of the party. It’s hard to establish to what extent this participation is going to stabilize or decrease in the next future: for sure, the new-effect seems to have come to an end and the absolute numbers of the first primaries seem to be hardly replicable. As instrument to politically legitimate the leadership, it seems that primaries can still mobilize a remarkable portion of Democratic electors. It’s up to each elector to establish, according to his/her preferences, what are the effects in terms of quality of the deliberation.
[1] Data reported here are still not official.
